
3,029 AI benchmarks, 99 RL environments: the field is over-indexed on evaluation
31 benchmarks for every 1 RL environment (3,029 : 99)
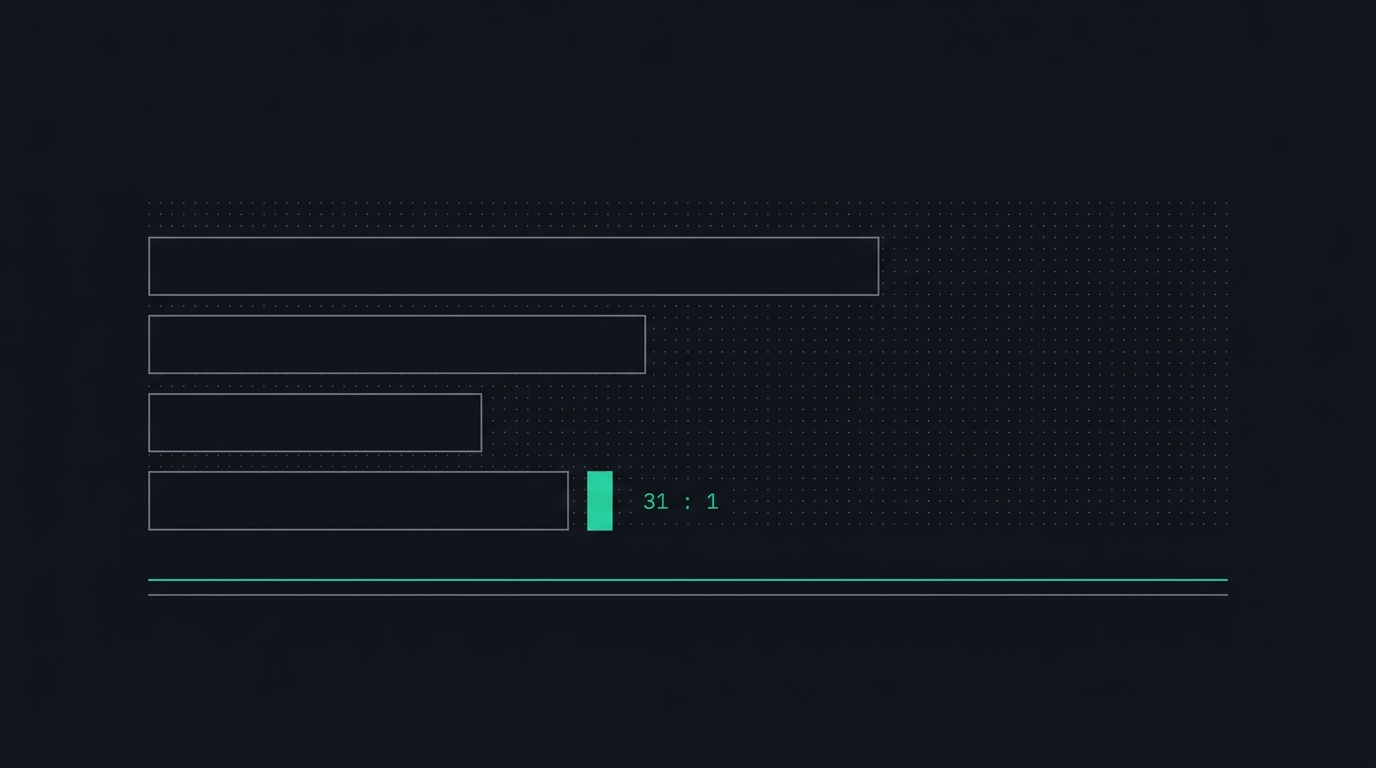
The benchmark pile keeps growing while catalogued RL environments stay rare and static. Our catalogue counts 3,029 unique benchmarks and 24,810 model score rows, against just 99 catalogued RL environments. That’s a 31-to-1 ratio. The leverage sits not in adding more benchmarks but in expert verification: this week, Surge trained a 4B model on 1,000 expert-written rubrics to parity with a model 60 times larger, and AfterQuery helped NVIDIA hill-climb GDPval. The pile of benchmarks grows. Expert verification moves the numbers.
Key Takeaways
- Our catalogue holds 3,029 unique benchmarks and 24,810 score rows against 99 RL environments: a 31-to-1 investment gap between measuring capability and producing it.
- Surge trained a 4B model on 1,000 expert-written rubrics to parity with a model 60x larger, and AfterQuery moved GDPval for NVIDIA. Expert verification, not benchmark count, moved the numbers.
- The rubric result isn’t a one-off: rubrics-as-rewards is now a documented training recipe in the research literature.
How many benchmarks exist and where do they live?
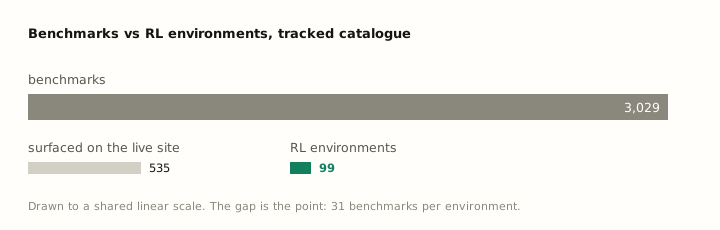
The catalogue tracks 3,029 unique benchmarks with 24,810 model score rows. Of these, 535 pass the bar for the live site view: sufficient structure, documentation, and model coverage to appear in the public catalogue. The rest are tracked but not surfaced.
Benchmark proliferation is a studied phenomenon, not a hot take. Ott et al. (2022) mapped 3,765 vision and NLP benchmarks and found most either saturate quickly or never get used at all. Our census says the dynamic hasn’t slowed: against 3,029 benchmarks, the environment catalogue holds 99 entries. The ratio is not improving. The environment count is static while benchmarks continue to accumulate.
How much actually changes day to day?
The benchmark pile is large but mostly settled. New benchmarks appear in bursts around conference cycles and vendor launches, not as a steady stream. The environment count is worse than slow-growing: it’s flat, with near-zero net change across consecutive observations. The whitespace identified in the June coverage study is not closing on its own.
What moves the numbers if benchmark count does not?
Two results this week make the case that expert verification is the lever:
- Surge trained a 4B-parameter model on 1,000 expert-written rubrics and reached parity with a model 60 times larger (June 29). The gain came from the quality of the grading criteria, not the quantity of training tasks. The research literature backs the recipe: Scale AI’s Rubrics as Rewards turned instance-specific expert rubrics into on-policy RL reward signals, and Rubric Anchors extended verifiable-reward RL to open-ended tasks with a 10,000-rubric system.
- AfterQuery helped NVIDIA hill-climb GDPval (July 2), applying on-policy distillation, the GKD method from Agarwal et al. (2023), to a frontier model’s performance on professional work. The +21.4% net win-loss gain it published in early June has the same shape: a small vendor moving a frontier metric through expert-generated signal.
The implication is direct. The 3,029 benchmarks are a stock, not a flow. They measure what models can do today. The 99 environments are the assets that change what models can do tomorrow, and the field is investing in measurement at 31 times the rate it invests in capability.
What this means
The marginal benchmark adds measurement, not capability. The marginal environment, with a verifiable reward and expert-calibrated ground truth, is what moves model performance. That’s the whole premise of RLVR, reinforcement learning with verifiable rewards (Lambert et al., 2024): the trainable asset is the verifier, not the eval. The Surge and AfterQuery results demonstrate it. The 31-to-1 ratio is the investment gap.
FAQ
What is the 31-to-1 benchmark-to-environment ratio?
3,029 catalogued benchmarks divided by 99 catalogued RL environments. The ratio measures the field’s over-investment in evaluation relative to the assets that produce trainable signal.
Why is the environment count static?
Building a production-grade RL environment requires expert authoring, verifier calibration, and pilot validation: months of work per environment. Adding a benchmark requires a dataset and a scoring script. The cost asymmetry explains the ratio, but it also means the gap will not close without sustained investment.
What is GDPval?
GDPval is a benchmark for professional work tasks across real occupations. Vendors publish training and evaluation results on it to demonstrate that their environments or expert data improve frontier-model performance on occupational work.