
How stable are AI leaderboards? One refresh moved 135 model scores
135 model scores changed in one August 29 refresh; 129 of them drifted upward together by at most 0.22 points

AI leaderboards move more in a day than most people assume, and most of that movement is the ruler, not the models. In the August 29 refresh of our model score tracking, 135 models had their composite scores updated at once, and 129 of them drifted upward together by at most 0.22 points. The drifting models came from 29 different makers: Google, xAI, Alibaba, Anthropic, Moonshot, Xiaomi, and two dozen more, all nudged the same direction on the same morning. Twenty-nine competitors do not ship improvements simultaneously; a scoring pipeline recalibrates simultaneously. One real story hid inside the same refresh: a single model, Qwen3.8-Flash-Next, fell 6.22 points while nothing else moved more than 0.22 in either direction. Telling those two kinds of movement apart, the ruler shifting under everyone versus one model actually being re-measured, is the whole skill of reading a leaderboard, and it is invisible if you only ever quote one model’s number.
Key Takeaways
- One routine refresh changed 135 of 24,840 tracked model score rows in a day.
- 129 of the 135 changes were small upward drifts, at most 0.22 points, spread across 29 different makers: the signature of recalibration, not of synchronized capability gains.
- The exception proves the method: one model fell 6.22 points alone, which reads as a genuine re-measurement rather than ruler movement.
What did one refresh actually change?
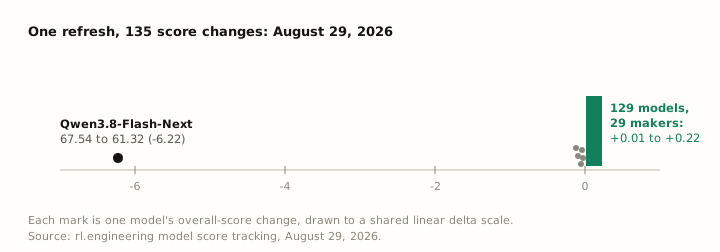
The refresh profile has two parts. A tight band of small gains, median just over a tenth of a point, covering nearly every model that changed. And one outlier: Qwen3.8-Flash-Next dropped from 67.54 to 61.32 while the next-largest decline in the entire refresh was 0.12. The band and the outlier are different kinds of events. The band moved models regardless of maker, size, or age, which no plausible set of independent model updates produces. The outlier moved one model by fifty times the median, which no rounding pass produces. Reading the band as recalibration and the outlier as a genuine re-measurement is analyst inference from the shape of the deltas, not a disclosure from any scorer, and we label it as such.
How do you tell recalibration from capability change?
Three checks work on any leaderboard, ours included:
- Cross-maker sync. Models from 29 unrelated companies moving the same direction on the same day points at the scorer, not the models.
- Breadth. A pass touching 135 scores at once is systematic. A capability release moves one model and its close variants.
- Magnitude sorting. Recalibrations produce many small, same-signed deltas. Genuine re-measurements produce a few large, isolated ones.
The same lens applies to third-party composites. Surge’s Tuesday Work Index runs for DeepSeek V4 Pro two days earlier and for Qwen 3.8 Max the week before are single-model measurements against published criteria, which is the interpretable kind of move. The uninterpretable kind is a composite score that changes without saying whether the definition changed, the trust problem our ground-truth research keeps pressing on verifiers and judges.
“V4 Pro scores 59.7 on the Tuesday Work Index”
Is the benchmark pile itself stable?
No. The same day’s snapshot added 11 benchmarks, taking the catalogue from 3,079 to 3,090, and the tracked environment count moved from 100 to 101, its first change in our daily observation window. Since the June census counted 3,029 benchmarks against 99 environments, the stock has grown by 61 benchmarks and 2 environments. The measurement pile compounds by the day; the assets that produce capability move by ones.
What this means
Treat any single-day leaderboard move as a measurement event until the shape of the surrounding deltas says otherwise. For researchers, cross-maker synchronization is the fastest recalibration test. For buyers and investors, a composite score is only as stable as its definition, and definitions change more often than capabilities do.
FAQ
Why would leaderboard scores get recalibrated at all?
Composite scores aggregate many benchmark results through weights and normalization, and those inputs change constantly: benchmarks get added or corrected, leaderboards update, aggregation rules improve. Each such change reprices every model it touches, which is how 135 scores can move in one day while almost none of the models did anything.
Does recalibration make a leaderboard untrustworthy?
No, it makes it an instrument, and instruments need recalibration. The trust question is visibility: a leaderboard that shows what moved and by how much supports interpretation, while one that shows only today’s number invites reading every move as capability.
How big is the tracked registry?
As of August 29, 2026: 24,840 model score rows, 3,090 benchmarks, and 101 RL environments, per rl.engineering tracking. Daily observation of day-over-day changes began in mid-August 2026.